Risk warning: Trading foreign exchange (forex) and CFDs on margin carries a high level of risk and may not be suitable for all investors. Leverage can work against you as well as for you, and you can lose more than you expect, in some cases more than your initial deposit. This article is for educational purposes only and is not financial or investment advice. Consider your objectives, experience, and risk tolerance, and seek advice from an independent, licensed financial professional if needed.
Forex traders generally use two broad approaches to analyze markets: fundamental analysis and technical analysis. Fundamental analysts ask why a currency might strengthen or weaken, looking at interest rates, economic data, and policy. Technical analysts focus on how prices are moving, studying charts, trends, and patterns. Debates about which approach is better are common, but many traders combine elements of both. Understanding each approach, along with its strengths and limitations, helps you build a more complete view of the market.
This guide explains fundamental and technical analysis in forex, compares them, and shows how traders often use them together.
Fundamental Analysis in Forex
Fundamental analysis evaluates the economic, financial, and political factors that influence a currency’s value. In simple terms, a currency’s value reflects demand for that currency, which is influenced by a country’s economic health, interest rates, and investor confidence.
Key fundamental drivers
- Interest rates and central bank policy: Higher interest rates, or expectations of rising rates, can attract investment flows and support a currency. Central bank statements, meeting minutes, and forward guidance are closely watched.
- Inflation: Inflation influences central bank decisions and purchasing power.
- Economic growth: GDP, retail sales, industrial production, and business surveys indicate economic strength.
- Employment: Labor market reports, such as U.S. nonfarm payrolls, can cause major market moves.
- Trade and current account balances: Reflect demand for a country’s goods and currency.
- Political stability and fiscal policy: Elections, government budgets, and geopolitical events affect confidence.
- Risk sentiment: In periods of uncertainty, investors may seek perceived safe-haven currencies.
How fundamental traders work
Fundamental traders follow the economic calendar, compare actual data with forecasts, and assess how surprises might change central bank expectations. They often focus on longer-term trends driven by interest rate differentials and economic divergence between countries. See economic calendar and news in currency markets.
Strengths
- Explains the underlying reasons behind major trends.
- Useful for longer-term positioning.
- Helps anticipate volatility around scheduled events.
Limitations
- Markets often price in expectations before data is released, so “good news” doesn’t always strengthen a currency.
- Timing entries precisely is difficult.
- Requires interpreting complex, sometimes conflicting information.
Technical Analysis in Forex
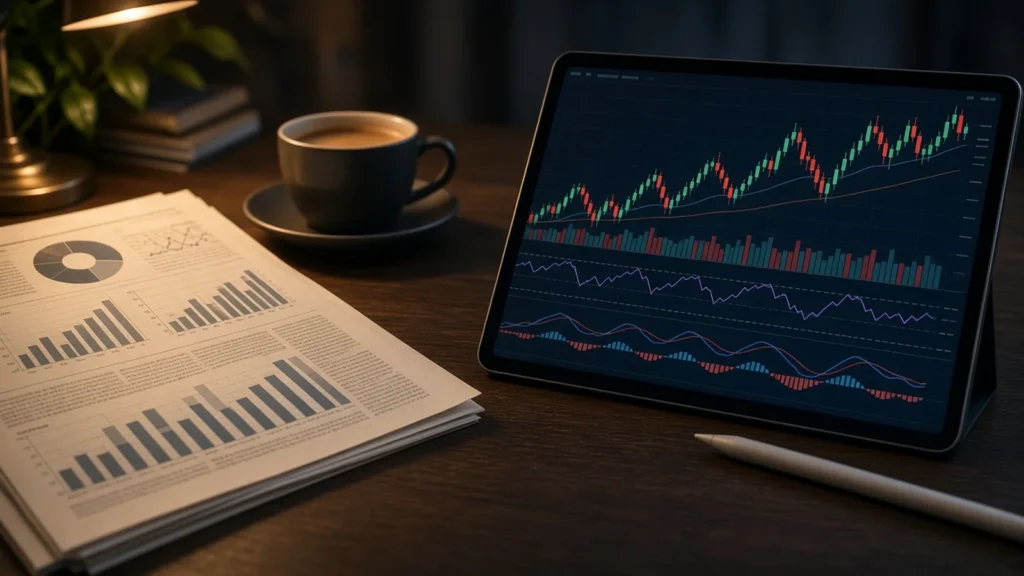
Technical analysis studies historical price and sometimes volume data to identify patterns, trends, and levels that may help anticipate future price behavior. It’s based on the idea that price reflects available information and that market participants’ behavior can create recurring patterns.
Common technical tools
- Trends and trendlines: Identifying whether price is making higher highs and higher lows, or lower highs and lower lows.
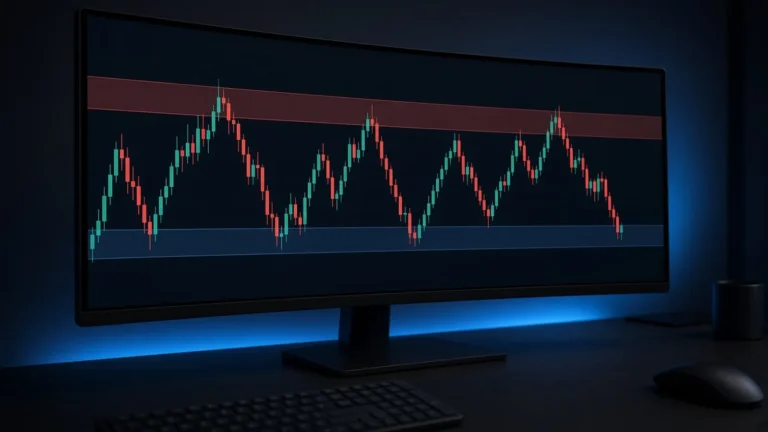
- Support and resistance: Price levels where buying or selling pressure has historically appeared; see support and resistance guide.
- Moving averages: Smooth price data to show trend direction.
- Oscillators: Indicators like RSI or stochastic that measure momentum and potential overbought or oversold conditions.
- Chart patterns: Formations such as triangles, double tops and bottoms, and head and shoulders.
- Candlestick patterns: Short-term price action signals.
- Volatility measures: Such as Average True Range (ATR) for setting stops; see stop-loss and take-profit orders.
Strengths
- Provides specific entry, exit, and stop levels.
- Applicable across timeframes and currency pairs.
- Rules can be tested on historical data.
Limitations
- Patterns can be subjective and are often clearer in hindsight.
- Indicators can produce false signals, especially in choppy markets.
- Major news can override technical levels abruptly.
- Over-optimizing strategies to past data can lead to poor future performance.
Side-by-Side Comparison
| Aspect | Fundamental analysis | Technical analysis |
|---|---|---|
| Main question | Why might the price move? | How is the price moving? |
| Data used | Economic data, policy, news | Price charts, indicators |
| Typical timeframe | Medium to long term | Any, often short to medium term |
| Strength | Big-picture context | Precise timing and risk levels |
| Weakness | Timing; expectations already priced in | False signals; news shocks |
Combining Both Approaches
Many traders blend the two:
- Use fundamentals for directional bias: For example, if one central bank is expected to raise rates while another is cutting, a trader might favor the higher-yielding currency.
- Use technicals for timing: Wait for a pullback to support in an uptrend or a breakout confirmation before entering.
- Respect the calendar: Avoid opening new positions immediately before major releases, or reduce size, regardless of the chart setup.
- Manage risk with technical levels: Place stops beyond key levels and size positions accordingly; see forex position sizing.
Sentiment Analysis: A Third Perspective
Some traders also consider sentiment, such as positioning data from futures reports or broker client positioning, to gauge whether a trade is crowded. Sentiment can help identify when a trend may be stretched, though it should be used alongside other analysis.
Which Approach Should You Choose?
Your choice depends on your personality, time availability, and trading timeframe:
- If you enjoy economics and longer holding periods, fundamentals may resonate.
- If you prefer clear rules and shorter-term trades, technical analysis may fit better.
- Most traders benefit from basic understanding of both.
Whatever you choose, test it thoroughly on a demo account before risking real money; see demo vs. live forex trading.
An Example of the Two Approaches Working Together
Imagine a trader following a currency pair after a central bank signals that it may keep interest rates higher for longer than markets expected, while inflation data from the other country in the pair has been cooling. From a fundamental perspective, this divergence might support a bias toward the first currency. Rather than buying immediately, the trader looks at the chart, notices that the pair is in an uptrend but extended far above its moving average, and decides to wait for a pullback toward a previous resistance level that may now act as support. The trader checks the economic calendar, sees a major inflation release in two days, and decides to either wait until after the release or use a smaller position. When an entry eventually comes, the stop is placed below the support zone and the position is sized so the potential loss stays within the trader’s risk limit.
This example is purely illustrative, and the outcome could just as easily be a loss. The point is the process: fundamentals help frame the idea, technical analysis structures the entry and exit, and risk management determines the size.
Frequently Asked Questions
Can technical analysis predict the future?
No. It identifies probabilities and levels based on past behavior, not certainties.
Do professional traders use technical analysis?
Many professionals use technical levels for timing and risk management, often alongside fundamental views.
How do I start learning fundamentals?
Begin with central bank policy and major data releases for the currencies you trade, and follow the economic calendar.
Are indicators necessary?
Not always. Some traders use clean price action with support and resistance; others use a few indicators. Avoid cluttering charts with many overlapping tools.
Conclusion
Fundamental analysis explains why currencies move, focusing on interest rates, economic data, and policy. Technical analysis shows how prices are moving, offering tools for timing entries and exits. Each has strengths and limitations, and many traders combine them: fundamentals for context and bias, technicals for timing and risk control. Neither approach guarantees profits, so pair your analysis with disciplined risk management and realistic expectations.
Risk warning: Trading foreign exchange (forex) and CFDs on margin carries a high level of risk and may not be suitable for all investors. Leverage can work against you as well as for you, and you can lose more than you expect, in some cases more than your initial deposit. This article is for educational purposes only and is not financial or investment advice. Consider your objectives, experience, and risk tolerance, and seek advice from an independent, licensed financial professional if needed.