Risk warning: Trading foreign exchange (forex) and CFDs on margin carries a high level of risk and may not be suitable for all investors. Leverage can work against you as well as for you, and you can lose more than you expect, in some cases more than your initial deposit. This article is for educational purposes only and is not financial or investment advice. Consider your objectives, experience, and risk tolerance, and seek advice from an independent, licensed financial professional if needed.
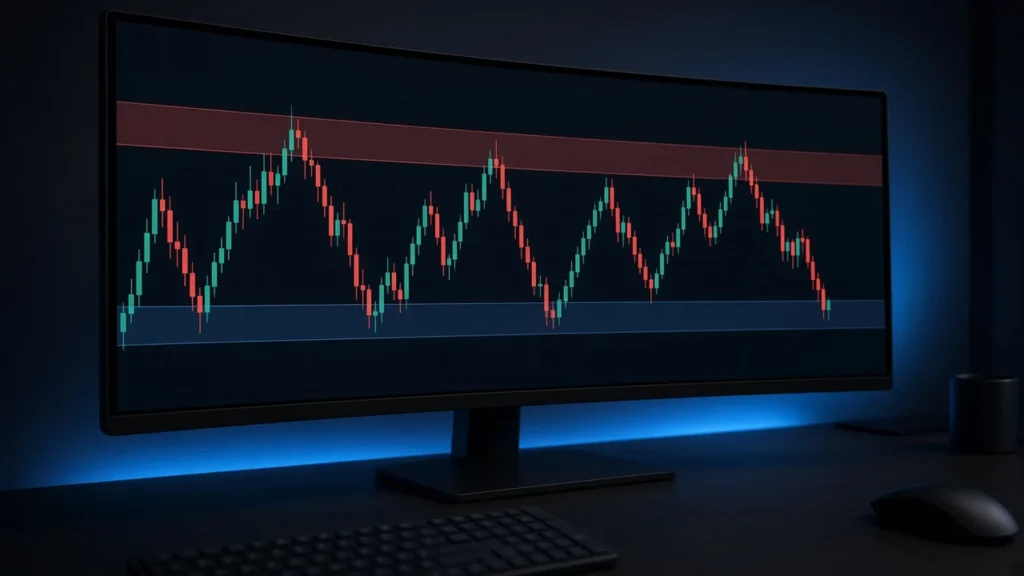
Support and resistance are among the most widely used concepts in technical analysis. Support is a price area where buying interest has tended to stop a decline; resistance is an area where selling interest has tended to stop a rise. Traders use these levels to plan entries, place stop-losses, and set profit targets. The concept is simple, but applying it well takes practice: levels are zones rather than exact lines, they can break, and not every level is equally meaningful.
This practical guide explains why support and resistance form, how to identify useful levels, how traders use them, and common mistakes to avoid.
Why Support and Resistance Form
Support and resistance reflect the collective behavior of market participants. Several factors contribute:
- Memory of past prices: Traders who missed buying at a level may buy if price returns there; those who bought higher may sell to break even when price recovers.
- Order clustering: Pending buy and sell orders, stop-losses, and take-profits often cluster around notable levels.
- Psychological round numbers: Levels like 1.1000 or 150.00 attract attention.
- Institutional activity: Large participants may defend or target certain levels, such as option-related levels or past highs and lows.
Because these behaviors are probabilistic, support and resistance increase or decrease the likelihood of a reaction; they don’t guarantee one.
Types of Support and Resistance
Horizontal levels
Drawn at prior swing highs and lows where price reversed or consolidated. These are the most common and often the most reliable.
Trendlines and channels
Diagonal lines connecting higher lows in an uptrend or lower highs in a downtrend. Channels add a parallel line on the opposite side.
Moving averages
Some traders treat widely followed moving averages as dynamic support or resistance.
Round numbers
Major figures such as 1.2000 in GBP/USD frequently act as reference points.
Previous period highs and lows
The prior day’s, week’s, or month’s high and low are watched by many traders. Session highs and lows can matter too; see forex trading sessions.
How to Identify Useful Levels
- Start on a higher timeframe: Levels visible on daily or weekly charts are generally more significant than those on short-term charts. Mark them first, then refine on lower timeframes.
- Look for clear reactions: Strong reversals or multiple touches suggest a meaningful level.
- Draw zones, not thin lines: Price often overshoots or falls short of exact levels. Mark an area covering the cluster of highs or lows.
- Consider recency: Recent levels often matter more than ones from years ago, though major historical levels can remain relevant.
- Avoid clutter: Too many lines make every price look significant. Focus on the few clearest levels near current price.
Role Reversal: When Support Becomes Resistance
When price breaks decisively through a support level, that level often acts as resistance on a later retest, and vice versa. This “role reversal” reflects traders who were caught on the wrong side looking to exit at break-even, and others who see the retest as confirmation. Many trading setups are built around waiting for a retest after a breakout rather than chasing the initial move.
Common Ways Traders Use Support and Resistance
1. Bounce or range trading
In a sideways market, traders may buy near support and sell near resistance, placing stops just beyond the zone. This works best when the range is well-defined and there’s no strong trend or upcoming major news.
2. Breakout trading
Traders enter when price breaks through a key level with momentum, expecting continuation. False breakouts are common, so many wait for a candle to close beyond the level or for a retest.
3. Pullbacks in a trend
In an uptrend, traders may wait for price to pull back to a former resistance area that has become support before buying, aligning with the trend while getting a better entry.
4. Placing stops and targets
Support and resistance provide logical places for stops (beyond the level where the trade idea fails) and targets (just before the next significant level). See stop-loss and take-profit orders.
Confirming Levels
Many traders look for additional evidence before acting at a level:
- Price action signals: Rejection candles, such as long wicks, or engulfing patterns at the level.
- Confluence: When a horizontal level coincides with a trendline, moving average, or round number.
- Momentum indicators: Divergences that may signal weakening momentum near a level.
- Fundamental context: Scheduled news can override technical levels; see economic calendar and news and fundamental vs. technical analysis.
Common Mistakes
- Treating levels as exact prices and placing stops right at them, where they’re easily hit.
- Drawing too many levels, leading to confusion and hindsight bias.
- Ignoring the trend: Buying at support in a strong downtrend often fails.
- Assuming levels never break: Every level eventually breaks; always use stops.
- Overtrading every touch rather than waiting for high-quality setups.
- Forgetting the spread: On short timeframes, spreads can affect whether orders near levels are filled.
A Practical Routine
- Each week, mark major support and resistance zones on the daily and weekly charts for the pairs you trade.
- Note the trend direction on the higher timeframe.
- Check the economic calendar for events that might cause volatility.
- Define in advance which setups you’ll consider at each zone: bounce, breakout, or retest.
- Calculate position size from stop distance and risk per trade; see forex position sizing.
- Record each trade in a journal with a screenshot of the levels.
Practice Before Trading Live
Identifying levels gets easier with practice. Review historical charts, mark levels without looking at what happened next, then scroll forward to see how price reacted. Combine this with demo trading to test your rules; see demo vs. live trading. Be honest about results, including the times levels failed.
Frequently Asked Questions
How many touches make a level valid?
There’s no fixed number. Two or more clear reactions are often considered meaningful, but more touches may also mean orders at the level are being absorbed, increasing the chance of a break.
Which timeframe is best?
Higher timeframes generally produce more significant levels. Shorter timeframes help refine entries.
Do support and resistance work in all markets?
The concept applies widely, including stocks and commodities, because it reflects market participant behavior, but reliability varies.
Should I use indicators to find levels?
Some tools plot pivot points or automatic levels, but many traders prefer marking levels manually from price history.
Conclusion
Support and resistance help traders read where buying and selling pressure has appeared and may appear again. Focus on clear, higher-timeframe zones, respect the trend, look for confirmation, and use levels to define stops and targets logically. No level is guaranteed to hold, so combine this tool with disciplined risk management and realistic expectations.
Risk warning: Trading foreign exchange (forex) and CFDs on margin carries a high level of risk and may not be suitable for all investors. Leverage can work against you as well as for you, and you can lose more than you expect, in some cases more than your initial deposit. This article is for educational purposes only and is not financial or investment advice. Consider your objectives, experience, and risk tolerance, and seek advice from an independent, licensed financial professional if needed.